MLB Prop Betting Shifts and the Pitch Clock Strikeout Effect
 Available in US
Adjusting Prop Strategies for Batter Timing and Game Pace
Opening Day 2023 was the first time I placed a K-prop bet with genuinely no historical data to lean on. The pitch clock had arrived – 15 seconds with bases empty, 20 seconds with runners on – and every model I had was built on a world without it. Would the faster tempo help pitchers by keeping batters uncomfortable? Would it hurt pitchers by disrupting their between-pitch routines? Would it change nothing meaningful for K totals? I had theories, but theories are not data. I bet small that first month and watched.
The pitch clock was MLB’s most aggressive pace-of-play intervention in modern history, and it achieved its primary goal immediately: average game time dropped by roughly 25 minutes. But the ripple effects on pitcher-batter dynamics – and specifically on strikeout rates – were more nuanced than the headlines suggested.
How the Clock Mechanics Work
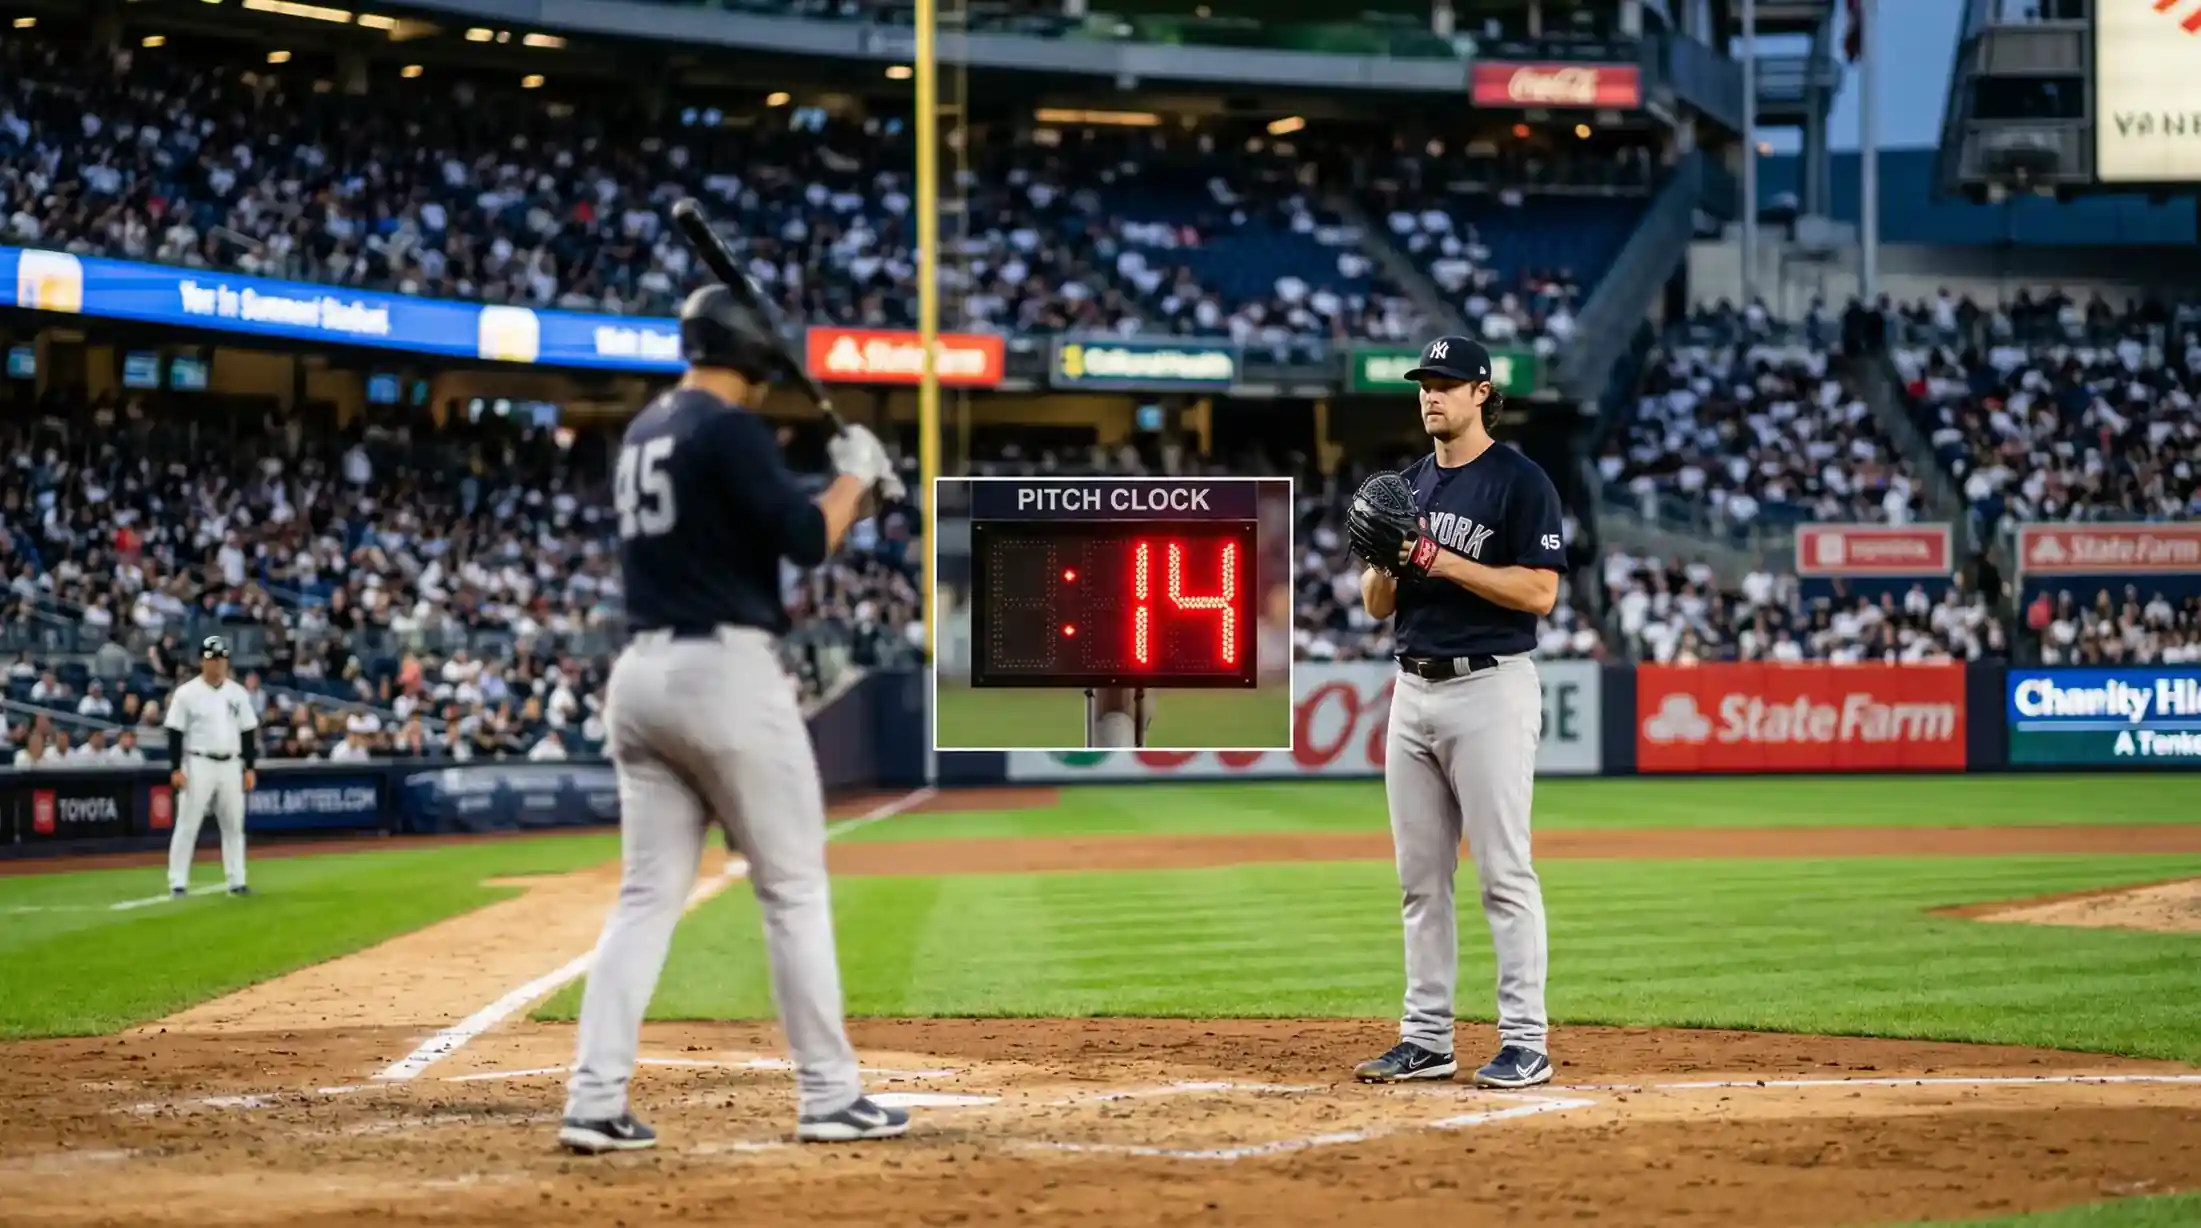
The pitch clock forces the pitcher to begin his delivery within a fixed window after the umpire signals the clock. With bases empty, the pitcher has 15 seconds from the time he receives the ball. With runners on base, the window extends to 20 seconds. The batter must be in the box and “alert to the pitcher” with at least 8 seconds remaining. Violations result in an automatic ball (against the pitcher) or an automatic strike (against the batter).
The mechanics changed the rhythm of at-bats in ways that affect K props through two channels. The first channel is preparation time. Before the clock, pitchers could step off, take their time, shake off signs, and disrupt the batter’s timing. Some pitchers used deliberate pacing as a competitive weapon – slowing the game to build tension in two-strike counts. The clock eliminated that tactic. The second channel is between-pitch adjustment. Batters used to have time between pitches to reset mentally, review scouting notes on their phone (in the dugout between at-bats), and compose themselves after a swing and miss. The compressed tempo reduces that recovery window.
The net effect on strikeouts was less dramatic than either side predicted. K-rates did not spike because pitchers lost their deliberate pacing. Nor did they crash because pitchers were rushing. The more interesting finding was at the margins: certain types of pitchers and certain types of batters were affected more than others.
What the K-Rate Data Shows Since 2023
League-wide K/9 remained near its pre-clock levels through the 2023-2025 seasons, fluctuating between 8.3 and 8.8 without a clear directional shift attributable to the clock. Total strikeouts per season stayed near the 42,000+ mark, consistent with the historical highs that preceded the rule change. On the surface, the clock did not move the K needle.
Beneath the surface, the data is more interesting. Pitchers who relied on slow, deliberate pacing – those who averaged more than 25 seconds between pitches before the clock – saw a measurable decline in their K-rates during the first half of 2023. Their timing was disrupted, and batters who had struggled against their slow tempo began performing better. By mid-season, most of these pitchers had adapted, and the K-rate gap closed. The initial disruption was real but temporary.
Conversely, pitchers who already worked quickly – under 20 seconds between pitches pre-clock – were largely unaffected. Their rhythms did not change, and their K-rates remained stable. This created a brief window of exploitable value in early 2023: fast-working pitchers were underpriced relative to slow-working ones because the market had not fully processed the differential impact of the clock. That window has closed now that three full seasons of clock-era data are available.
On the batting side, hitters who were prone to chasing pitches outside the zone – high O-Swing% batters – showed a slight increase in K-rate in the clock’s early implementation. The reduced preparation time between pitches may have made it harder for these free-swinging batters to exercise whatever restraint they had. Disciplined hitters were essentially unaffected. For K-prop purposes, this means the clock slightly amplifies the K vulnerability of high-chase lineups without changing the profile of disciplined ones.
Adjusting Your K-Prop Strategy for the Clock Era
After three full seasons of pitch-clock data, the adjustment to K-prop strategy is more about updating priors than about making dramatic changes. The clock is a known quantity now – sportsbook lines already incorporate clock-era K-rates, and the initial exploitable mispricings have been arbitraged away.
There are still edge cases worth monitoring. The first is September callups. When young pitchers are called up from the minors in September, they bring minor-league timing habits to the major-league stage. Some minor-league pitchers work at a different tempo than their major-league counterparts, and the adjustment to the big-league clock can disrupt their rhythm for their first few starts. If a September callup has elite K stuff but has not pitched under the major-league clock regularly, that is a small negative factor for K-over bets on his first few appearances.
The second edge case is postseason intensity. Postseason games carry more pressure, more mound visits, and more deliberate pacing. The clock still applies, but pitchers and batters both tend to push its limits more frequently in high-stakes situations. Postseason K-rates have been slightly higher than regular-season rates in the clock era, partly because the emotional intensity benefits pitchers more than batters. If you bet K props in October, the slight postseason K bump is worth noting.
The third and most practical adjustment is to stop overthinking the clock. It is baked into the data now. If you are building a K-prop model using 2024-2026 statistics, the clock effect is already embedded in every pitcher’s K-rate, every lineup’s K-rate, and every game’s outcome. You do not need a separate clock adjustment factor in your calculator – it is already there in the base rates. Focus your analytical energy on the factors that still create genuine edges: matchup quality, umpire assignment, weather, and pitch-count management. For a broader look at what the K-rate trajectory means for the betting landscape in 2026, the article on MLB strikeout rate history traces the full 25-year trend.
How does the pitch clock rule affect strikeout rates?
The pitch clock’s impact on league-wide K-rates has been modest. K/9 remained in the 8.3-8.8 range through three full seasons of the rule, without a clear directional shift. Slow-working pitchers saw temporary K-rate declines in early 2023 but adapted quickly. The clock slightly amplifies K vulnerability in high-chase lineups by reducing batters’ preparation time between pitches.
Has the pitch clock changed the optimal K-prop strategy?
Not dramatically. Three seasons of clock-era data mean the effect is already embedded in current statistics. Sportsbook lines incorporate clock-era K-rates, and the initial mispricings from 2023 have been arbitraged away. Focus your analysis on matchup quality, umpire assignment, and pitch-count factors rather than adding a separate clock adjustment to your model.
Written by the editors at mlb Strikeout Prop Bets.