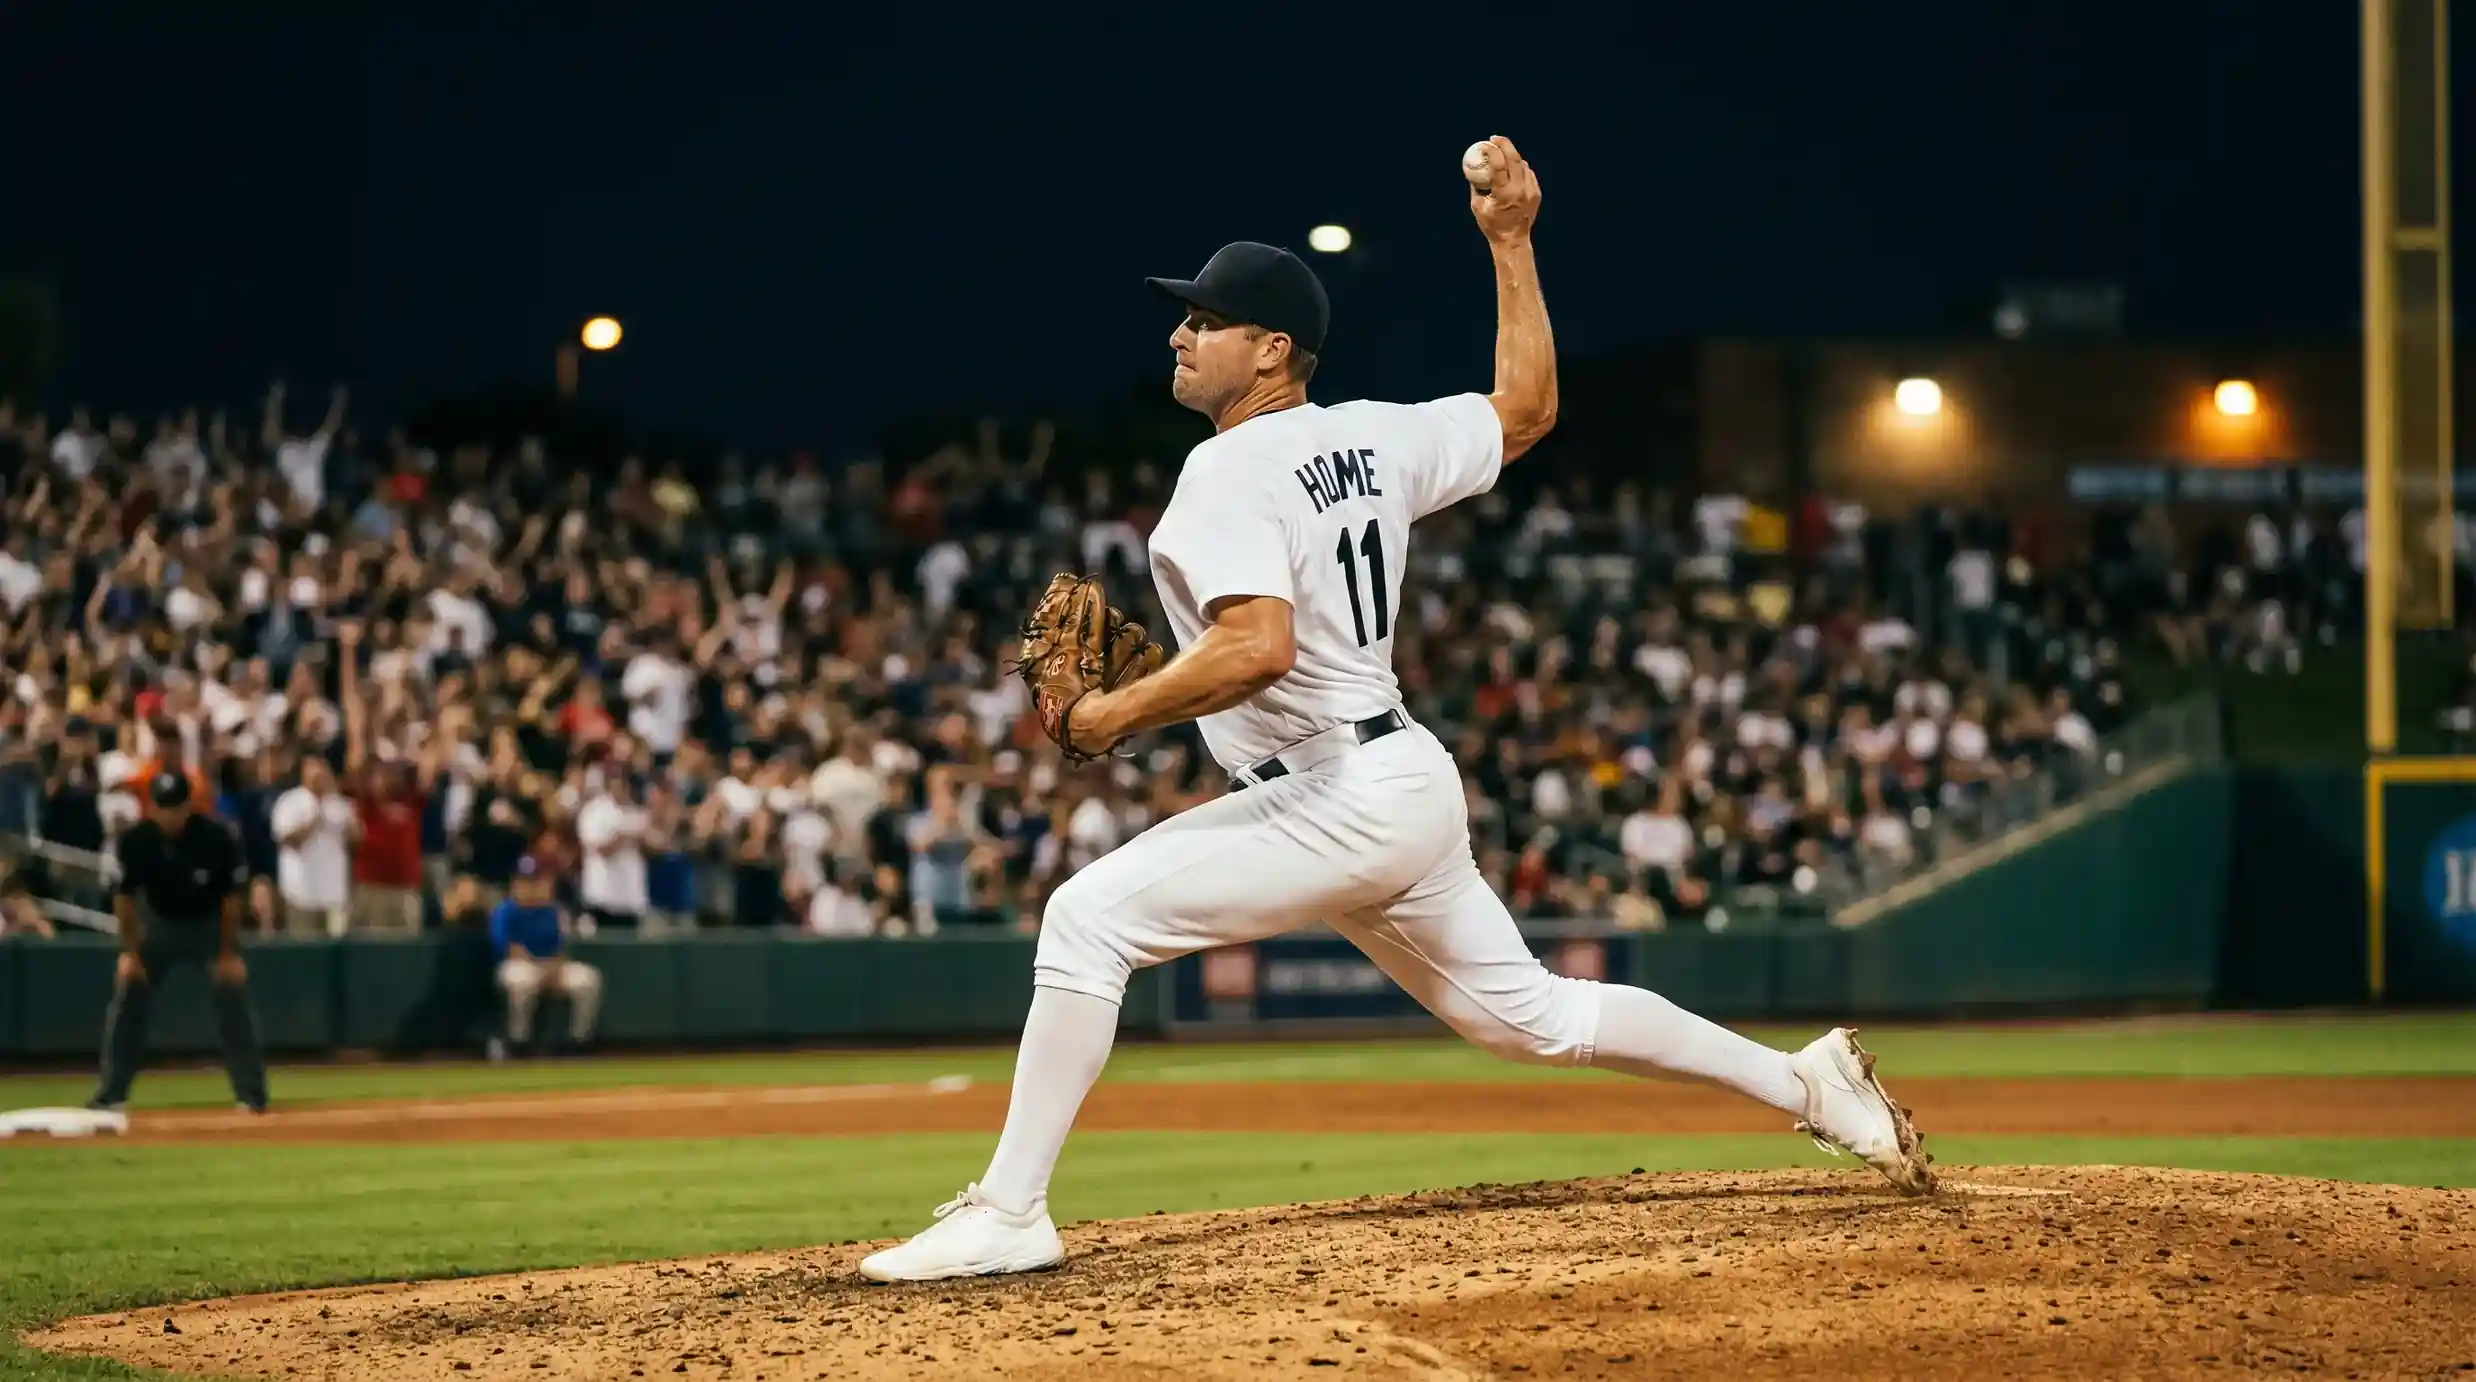
Strikeout-Prone MLB Lineups: Why the Opposition Matters as Much as the Pitcher
Índice de contenidos
- Strikeout-Prone MLB Lineups: Why the Opposition Matters as Much as the Pitcher
- 2026 Team Strikeout Rate Rankings: Top 10 Targets
- Handedness Splits: Where Left-Handed Pitchers Gain Extra Ks
- Batter-vs-Pitcher History: When Small Samples Tell the Truth
- Lineup Volatility: Rest Days, Callups, and Sunday Swaps
- Stacking the Matchup: Pitcher Elite + Lineup Weak = Over
- FAQ
Strikeout-Prone MLB Lineups: Why the Opposition Matters as Much as the Pitcher
I spent my first few years betting K props exclusively based on the pitcher. His K/9, his SwStr%, his recent form — the starter was the entire analysis. Then I tracked a month of results and noticed something I should have seen sooner: my win rate on overs jumped by nearly twelve percentage points when the opposing lineup’s team K-rate was above 25%. The pitcher was half the equation. The lineup was the other half, and I had been ignoring it.
This should be obvious, but it is worth stating plainly. A strikeout requires two participants: a pitcher who generates swings and misses, and a batter who swings and misses. The most devastating slider in baseball produces zero strikeouts if every batter in the lineup takes it for a ball or fouls it off. Conversely, a pitcher with merely average stuff can pile up Ks against a lineup full of hitters who chase pitches out of the zone and whiff at secondary offerings.
The Oakland Athletics opened the 2026 season with a record team K-rate of 37.8% through their first 180 plate appearances — the worst in the league by a comfortable margin. The Chicago White Sox were not far behind at roughly 36%. When an elite strikeout pitcher drew one of those lineups, the over was not just a strong bet — it was close to a market inefficiency, because sportsbook models often underweight the magnitude of extreme team-level K-rates when setting individual pitcher props.
2026 Team Strikeout Rate Rankings: Top 10 Targets
Every morning during the season, before I look at any individual pitcher’s numbers, I check which teams are on the wrong end of the K-rate leaderboard. This step takes thirty seconds and immediately tells me which games have the highest structural probability of producing strikeout-heavy outings.
The teams at the top of the K-rate table tend to stay there. Roster construction drives team-level strikeout tendencies far more than in-season adjustments. A team built around power hitters who sell out for home runs will strike out at a high rate all year because the approach is baked into the roster’s DNA. Conversely, a team built around contact hitters and on-base discipline will remain difficult to strike out regardless of who is on the mound. The correlation between early-season team K-rate and end-of-season team K-rate is strong enough that the first two weeks of data already provide a useful signal. This matters more now than ever: league-wide K/9 has risen from 5.15 in 2000 to above 8.6 in recent seasons, which means even average lineups strike out at rates that would have been considered extreme two decades ago.
Oakland’s 37.8% K-rate in early 2026 was not a surprise if you followed their off-season. They shed several contact-oriented bats and replaced them with younger, more swing-happy hitters who were still adjusting to major-league velocity. That roster profile screamed «strikeout factory» before a single pitch was thrown. The White Sox, sitting at roughly 36%, followed a similar pattern — a rebuilding team whose lineup lacked the discipline and experience to lay off quality breaking balls.
Beyond the obvious bottom-dwellers, the more profitable targets are often the teams ranked fifth through tenth in league-wide K-rate. These teams are not terrible enough to attract widespread attention from K-prop bettors, so the market does not fully price in their K tendencies. A team striking out at 27% is not going to show up on any social media «best K-prop targets» list, but that rate is still well above the league average and creates a measurable edge when paired with an above-average strikeout pitcher.
I track these rankings on a rolling thirty-day basis rather than relying on full-season numbers. Teams’ K-rates shift throughout the year as players get injured, promoted, or traded. A team that was the league’s best target in April might drop to fifteenth by July if they acquire a disciplined bat at the trade deadline. The rolling window catches these shifts faster than cumulative season data, which is slow to move once three months of plate appearances are baked in.
One final note on rankings: always check the K-rate split by pitcher handedness. A team that strikes out 28% overall might strike out 32% against left-handers and only 24% against right-handers. That split is enormous. If a left-handed pitcher is starting against that team, the matchup is significantly better than the overall K-rate suggests. If a right-hander is starting, the overall number overstates the opportunity. I maintain two separate columns in my tracking sheet — one for each handedness — and the extra sixty seconds of daily upkeep pays for itself many times over.
Handedness Splits: Where Left-Handed Pitchers Gain Extra Ks
A question I get asked constantly: do left-handed pitchers strike out more batters than right-handers? The short answer is «it depends entirely on who they are facing.» The longer answer involves platoon advantage, and understanding it is one of the quieter edges in K-prop analysis.
Platoon advantage is the statistical tendency for pitchers to perform better against batters of the opposite hand. Right-handed pitchers tend to be more effective against left-handed batters, and left-handed pitchers tend to dominate right-handed batters. The advantage exists because of the way breaking balls move relative to the batter’s eye line — a slider from a right-hander breaks away from a lefty batter, making it harder to track, while the same slider breaks into a righty batter, making it easier to see and foul off.
For K-prop purposes, the platoon advantage matters most when it is extreme. A left-handed pitcher facing a lineup stacked with right-handed bats has a structural edge in generating strikeouts. His slider moves away from the majority of the batting order, his changeup fades to the arm-side against right-handers, and the batting order has fewer same-side hitters who might neutralise his advantage. I have tracked this split over several seasons and consistently found that left-handed pitchers facing predominantly right-handed lineups outperform their season K-rate by roughly 8-12%.
The reverse is also true and just as valuable. A right-handed pitcher facing a lineup loaded with left-handed bats gains a similar platoon edge. These situations arise less frequently because most MLB lineups are majority right-handed, but when they do appear — often in interleague play or against teams with unusual roster construction — the K-prop value is substantial.
Where the platoon edge gets interesting is at the lineup construction level. Managers often stack their lineups to neutralise the opposing pitcher’s platoon advantage — putting right-handed batters in against a left-handed starter, for instance. But teams with shallow benches or weak platoon alternatives sometimes cannot make the switch. When a manager sends out a lineup that is poorly matched by handedness, either because of injuries, rest days, or a thin roster, the opposing pitcher’s K-prop over becomes more attractive than the raw team K-rate suggests.
I keep a watchlist of teams with limited platoon flexibility. These are typically rebuilding clubs or small-market rosters that do not carry a deep bench of quality hitters on both sides of the plate. When one of these teams faces a starter whose platoon advantage is pronounced — a lefty with a sweeper that devastates right-handed hitters, for example — the K-prop over gets a significant boost in my model. The market rarely prices in the absence of a platoon counter, because sportsbook models tend to use full-roster K-rate data that assumes the manager will make the optimal lineup choice. When he cannot, the line is built on a false assumption.
Batter-vs-Pitcher History: When Small Samples Tell the Truth
Batter-versus-pitcher data is the most seductive and most dangerous tool in K-prop analysis. Seductive because the numbers feel specific and actionable. Dangerous because the sample sizes are almost always too small to be statistically meaningful.
Consider this: Jazz Chisholm Jr. has a 53.8% K-rate in his career against Logan Webb — 7 strikeouts in 13 at-bats. That number screams «over» if Webb is starting against Chisholm’s team. But thirteen at-bats is not a sample; it is an anecdote. The difference between 7-for-13 and 5-for-13 is two swings, and the K-rate would drop from 53.8% to 38.5%. A single well-located pitch or a fortunate foul ball changes the entire narrative.
So when does BvP data actually matter? I use it as a supplementary signal — never as a primary driver — under two conditions. First, the sample needs to be at least thirty plate appearances. Below that threshold, the variance is too wide to draw reliable conclusions. Thirty is not a magic number, but it is the rough boundary where statistical patterns begin to stabilise enough to distinguish signal from noise. Second, the BvP trend needs to align with the broader matchup picture. If a batter strikes out 40% of the time against a specific pitcher across forty plate appearances and that same batter also has a 30% K-rate against all left-handed pitching, the BvP data is reinforcing a pattern that already exists. That is signal. If the BvP data contradicts the broader splits — a disciplined hitter who inexplicably whiffs at 45% against one particular righty — I treat it as noise unless I can identify a mechanical explanation.
The most useful application of BvP data for K props is not at the individual batter level but at the aggregate lineup level. Instead of checking one batter’s history against the pitcher, I scan how the pitcher has historically performed against the team as a whole. If a starter has faced the same team three times this season and struck out 24, 21, and 26 batters across those three games — sorry, that is the team’s K totals across all plate appearances against him — the pattern is more robust than any individual matchup. Team-level BvP captures lineup-wide tendencies, which is exactly what a K-prop bet is actually predicting.
My recommendation for UK bettors who are newer to MLB analysis: ignore individual BvP data entirely until you are comfortable with the other factors in your model. Team K-rate, handedness splits, and pitcher SwStr% will carry your analysis much further than trying to decipher whether a specific batter’s 12-for-31 record against a specific pitcher means anything. Once those fundamentals are solid, BvP data becomes a useful seasoning — never the main ingredient, but occasionally the detail that tips a borderline decision.
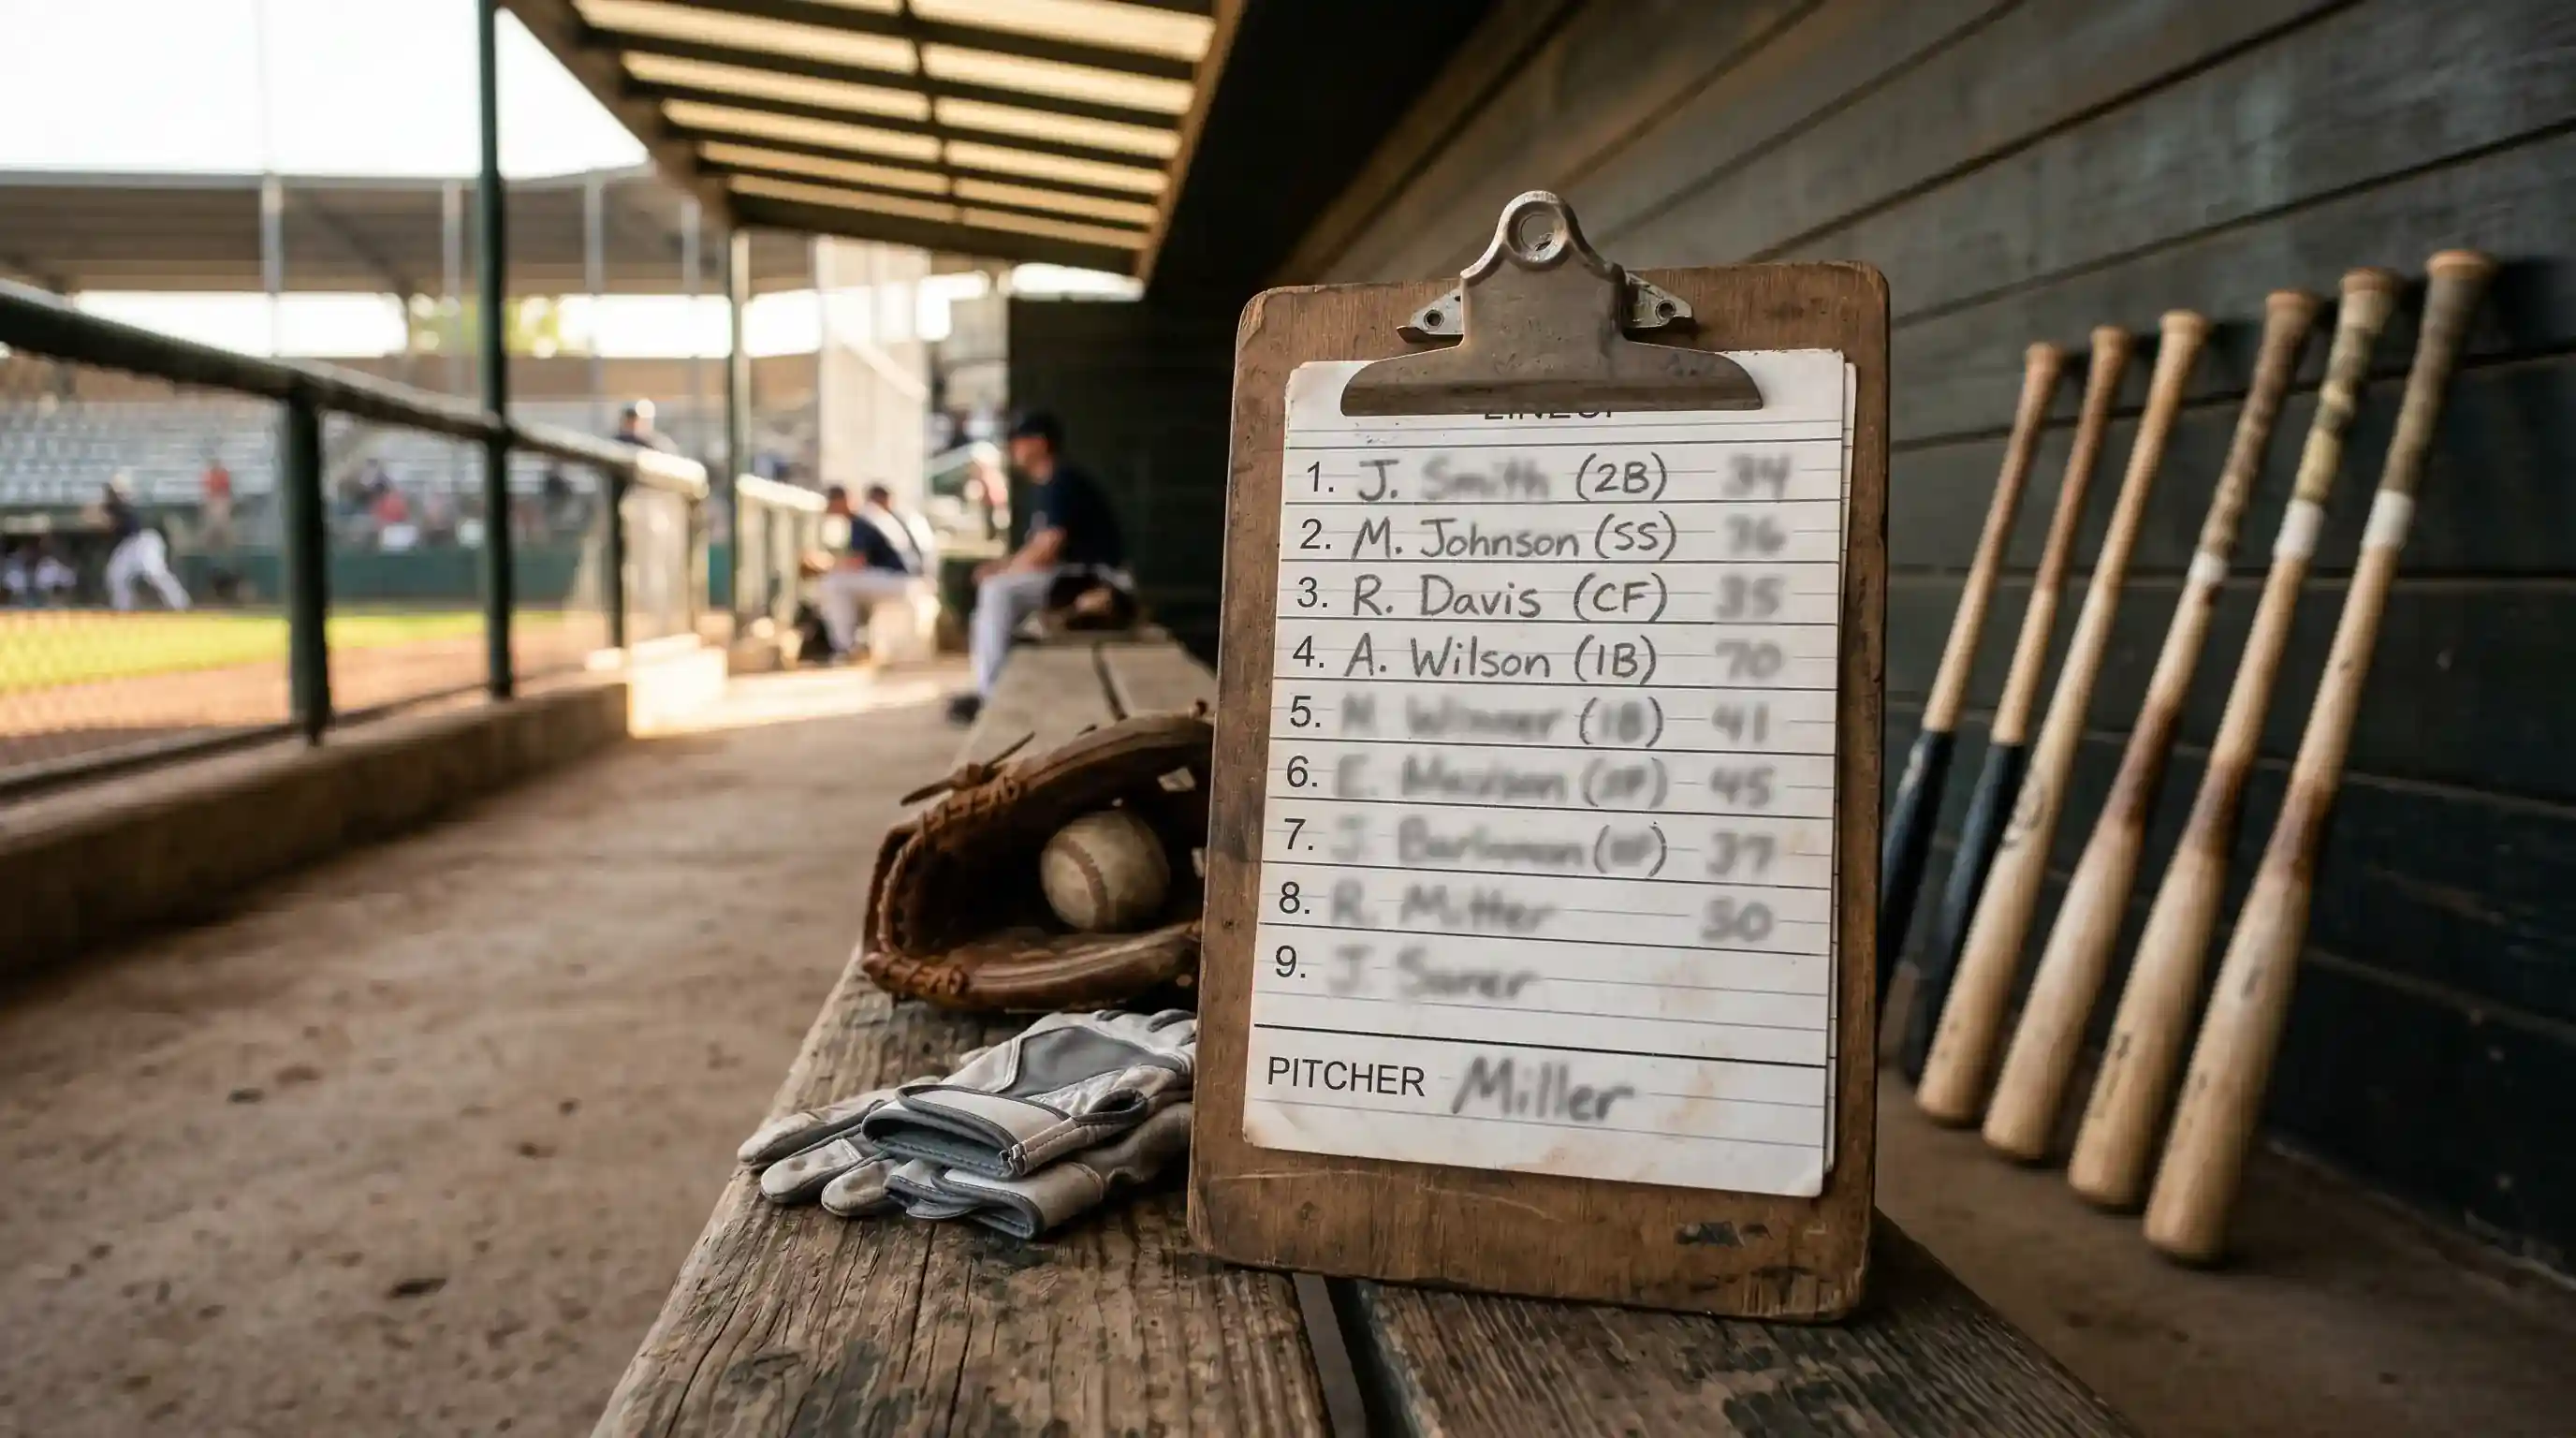
Lineup Volatility: Rest Days, Callups, and Sunday Swaps
Last September I bet an over on a pitcher facing a team that had struck out at 28% all season. The over lost by two Ks. When I checked the box score, three of the team’s regular starters were not in the lineup. They had been replaced by bench players and a September callup — hitters with lower K-rates, better plate discipline, and zero prior at-bats against the pitcher. The team I bet against was not the team that actually played.
Lineup volatility is the silent killer of K-prop analysis. You build your model around a team’s known batting order, and then the manager posts a lineup card that replaces two or three regulars with backups. The reasons vary: rest days in the final month, day games after night games, minor injuries that do not warrant the injured list, or Sunday rotations where the backup catcher and utility infielder get starts. Whatever the cause, the effect is the same — the lineup you analysed is not the lineup that is batting.
Strikeout props tend to offer the most value when elite strikeout pitchers face high-K lineups, as Jason Ziernicki has observed. But that principle requires the high-K lineup to actually show up. If the team’s three highest-K batters are sitting and replaced by contact-oriented veterans getting their monthly start, the matchup dynamics shift. The team’s effective K-rate for that game might be four or five percentage points lower than the season-long number.
My approach to lineup volatility is defensive. I never place a K-prop bet before lineups are confirmed, which for MLB games typically happens about ninety minutes before first pitch. That means I do my initial screening in the morning, identify candidates, and then wait. If the lineup card confirms the regulars are playing, I place the bet. If it shows significant changes — two or more starters replaced — I reassess the matchup from scratch. Sometimes the replacements are even more strikeout-prone than the regulars, which strengthens the over case. More often, the replacements are disciplined bench players, which weakens it.
Sundays and day games after night games are the highest-volatility spots on the calendar. I have started treating Sunday K-prop bets as a separate category in my tracking log, and the data confirms what I suspected: my win rate on Sunday overs is about five percentage points lower than my weekday win rate, almost entirely because of lineup swaps I failed to anticipate or adjust for quickly enough.
Stacking the Matchup: Pitcher Elite + Lineup Weak = Over
Everything in this article converges on a single principle: the best K-prop overs happen when pitcher quality and opponent vulnerability overlap. Neither factor alone is sufficient. An elite pitcher against a disciplined lineup is a break-even proposition at best. A mediocre pitcher against a high-K lineup produces similarly thin margins. But an elite pitcher against a high-K lineup is an edge — and it is the only configuration I consistently size up.
I think of this as a two-axis matrix. The vertical axis is the pitcher’s swinging strike rate — his ability to generate whiffs independent of who is batting. The horizontal axis is the opposing lineup’s K-rate against the pitcher’s handedness. When both axes are strong, the bet lands in the upper-right quadrant, which is where I allocate my largest unit sizes. When one axis is strong and the other is average, the bet sits in a middle quadrant and gets a standard unit. When both axes are average or weak, the bet does not get placed.
The stacking effect is not just additive — it is compounding. A pitcher with a 13% SwStr% facing a team with a 29% K-rate against his handedness does not just have two separate advantages; he has a matchup where his best pitches exploit the lineup’s worst tendencies simultaneously. His slider that generates 32% whiff rates meets batters who chase sliders at 38%. His changeup that fades away from opposite-hand hitters meets a lineup stacked with opposite-hand bats who struggle to lay off the pitch. The entire at-bat is tilted in the pitcher’s favour from the first pitch to the last.
When I find a stacked matchup, I do one final sanity check: the line itself. If the sportsbook has already priced in the overlap — setting the line at 7.5 or higher with steep juice on the over — the market has caught up and the value is gone. But more often than not, especially for midweek games that receive less public attention, the line does not fully reflect the stacking effect. The sportsbook’s model may account for the pitcher’s K-rate and the team’s K-rate separately without fully capturing the interaction between the two. That gap is small, and it does not appear every day. But over a full season of 2,430 games, it appears often enough to form the backbone of a profitable K-prop strategy.
The frequency of truly stacked matchups varies across the schedule. In April, when the full thirty teams are playing and lineups are still settling, I find roughly three to five stacked matchups per week. By June, when sportsbook models have incorporated more data and lines tighten, the number drops to one or two. In September, expanded rosters and strategic rest introduce enough chaos that the stacking effect becomes less predictable. Understanding these rhythms helps set realistic expectations — you are not going to find a stacked matchup every night, and the months where they are scarce are the months where discipline matters most.
FAQ
How often do MLB teams change their batting lineup?
Daily. MLB managers adjust their lineups for virtually every game based on the opposing pitcher’s handedness, rest needs, and matchup considerations. The core of the lineup — typically the first through fifth batters — remains relatively stable, but the bottom third rotates frequently. On Sundays and day games following night games, expect two to four lineup changes from the previous day’s card. Always confirm lineups before placing a K prop, as even a single substitution in the heart of the order can shift the matchup dynamics.
Do left-handed pitchers have higher K rates versus right-handed batters?
Yes, as a general rule. The platoon advantage gives left-handed pitchers a structural edge against right-handed batters — breaking balls move away from the batter’s swing path, making them harder to track and more likely to generate swings and misses. The effect is typically an 8-12% improvement in the pitcher’s K-rate compared to his performance against same-side batters. Right-handed pitchers enjoy the same advantage against left-handed batters, though this matchup occurs less frequently because most MLB lineups are majority right-handed.
How reliable is batter-vs-pitcher data in small sample sizes?
Not very. Below thirty plate appearances, BvP data is overwhelmed by variance and should not be used as a primary input for K-prop decisions. Even at thirty-plus plate appearances, BvP data is most useful when it confirms a trend already visible in the broader splits — such as a batter who strikes out frequently against all left-handed pitching and also has a high K-rate against a specific left-hander. When BvP data contradicts the broader pattern, treat it with scepticism unless you can identify a mechanical explanation.
Which MLB division has the most strikeout-prone offences in 2026?
Early-season data in 2026 pointed to the American League West and the American League Central as the divisions with the highest aggregate K-rates, driven largely by rebuilding rosters in Oakland and Chicago. However, divisional rankings shift as the season progresses, particularly around the trade deadline when contending teams acquire disciplined bats and rebuilding teams call up aggressive young hitters. Check rolling thirty-day team K-rates rather than relying on April data to make July bets.
Preparado por la redacción de «mlb Strikeout Prop Bets».