MLB Strikeout Rate History and Prop Betting Trends
 Available in US
Forecasting Modern Betting Markets Using Historical K Rates
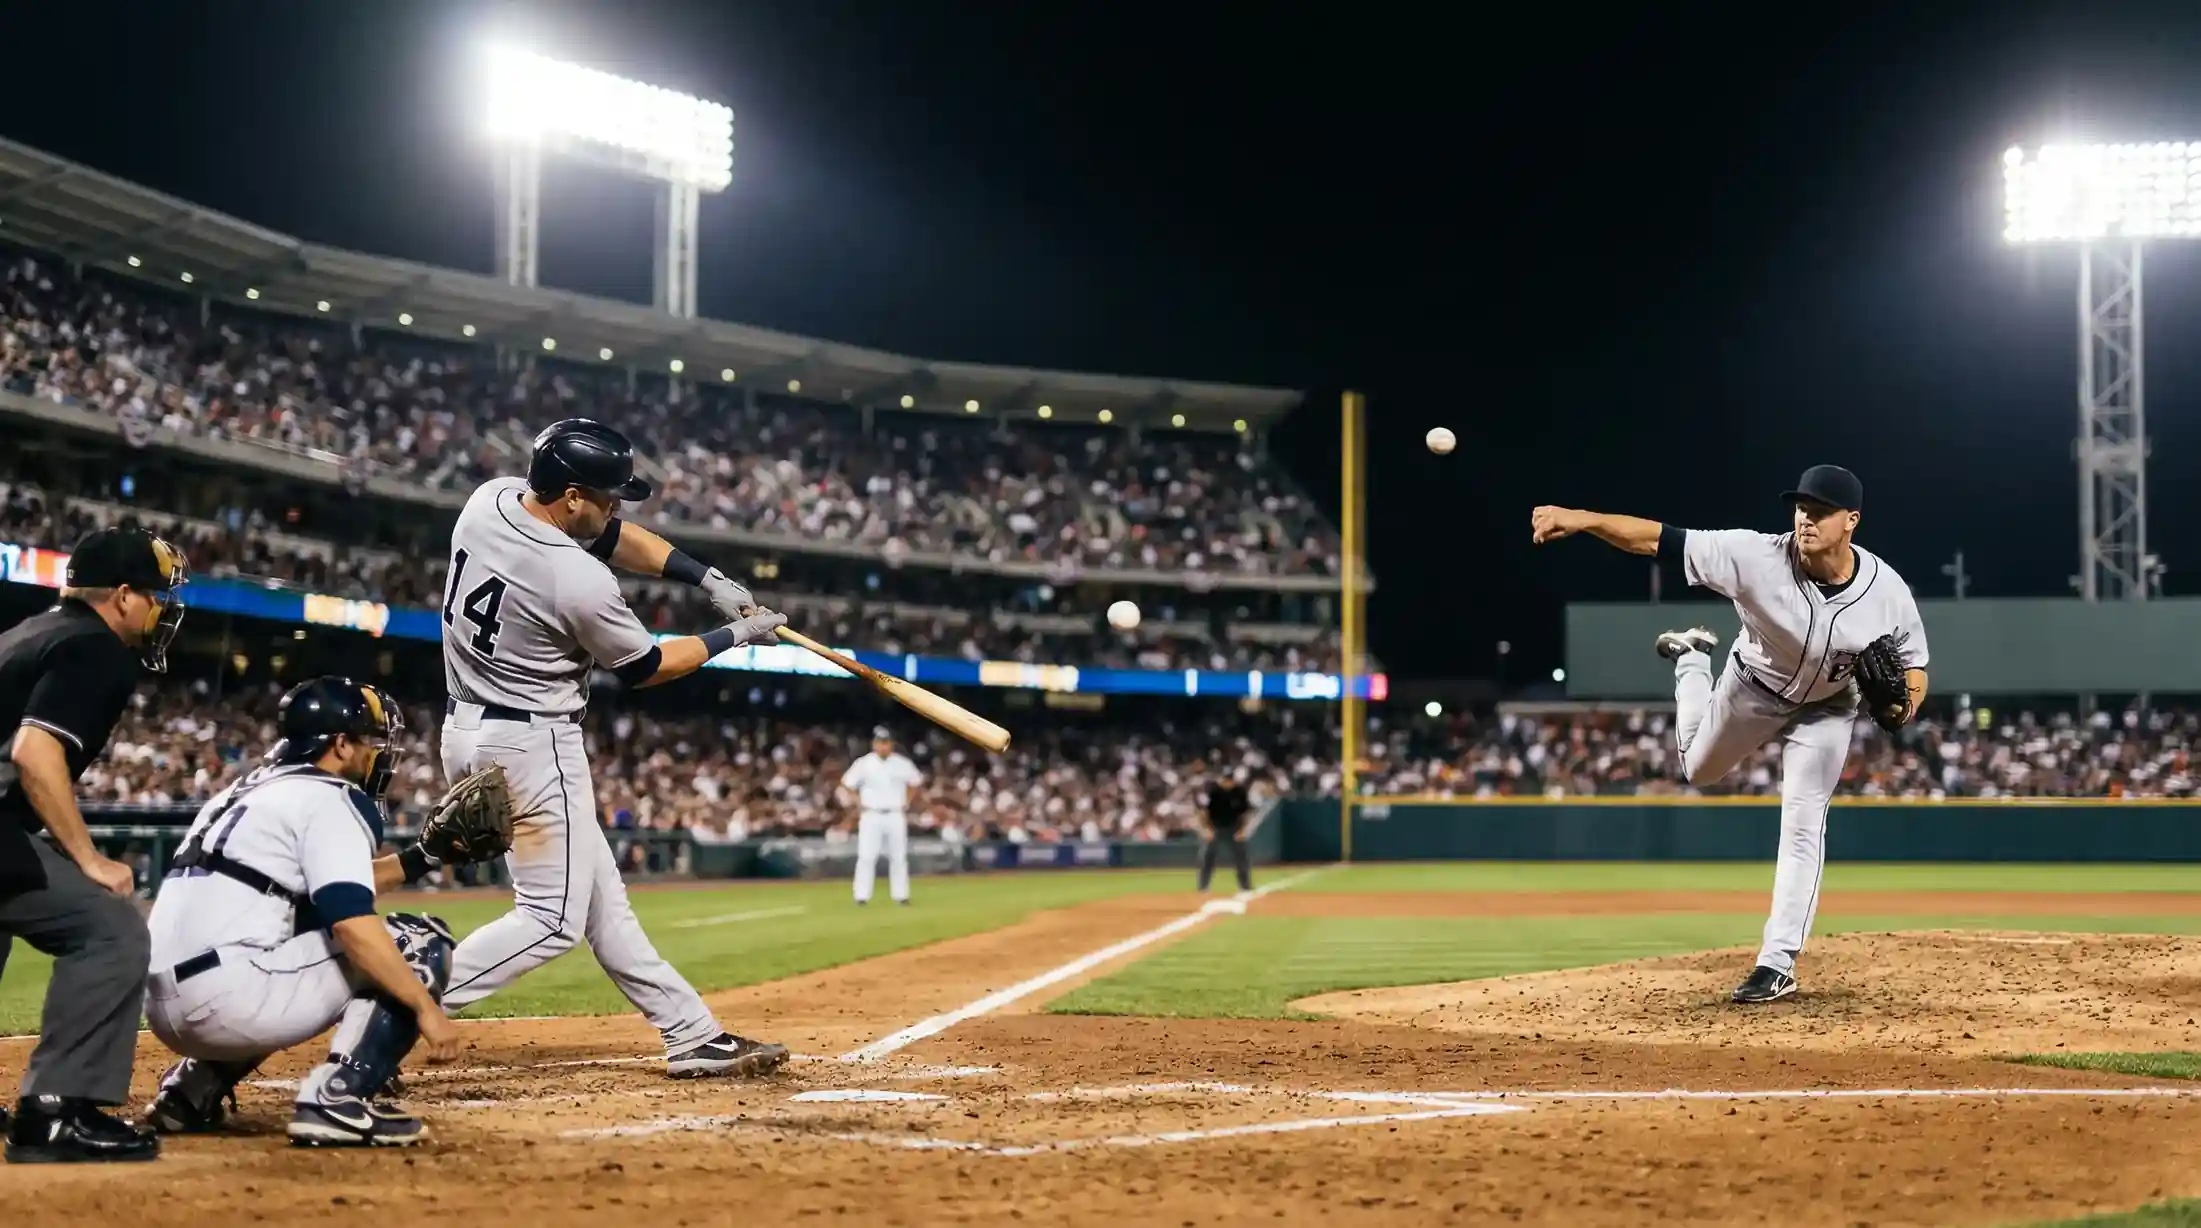
In the year 2000, the average MLB pitcher struck out 5.15 batters per nine innings. By the 2023-2025 stretch, that number had climbed past 8.6 K/9 – a roughly 67% increase over 25 years. The total number of strikeouts across the league has pushed past 42,000 per season in recent years, hovering near all-time records. Baseball did not just nudge the K-rate upward. It fundamentally restructured itself into a sport where swinging and missing is the norm rather than the exception.
For bettors, this trend is not just a historical curiosity. It is the backdrop against which every K-prop line is set, and understanding how we got here helps you evaluate whether the trend continues, plateaus, or reverses – which directly affects how you approach strikeout props going forward.
Decade by Decade: How the K-Rate Climbed
The early 2000s were the tail end of the so-called Steroid Era, when offence dominated and pitchers were fighting for survival. K/9 sat in the low 6s for most of the decade, ticking upward slowly as teams began to value strikeouts as a pitching tool rather than a luxury. The league-wide K/9 crossed 6.5 around 2008 and never looked back.
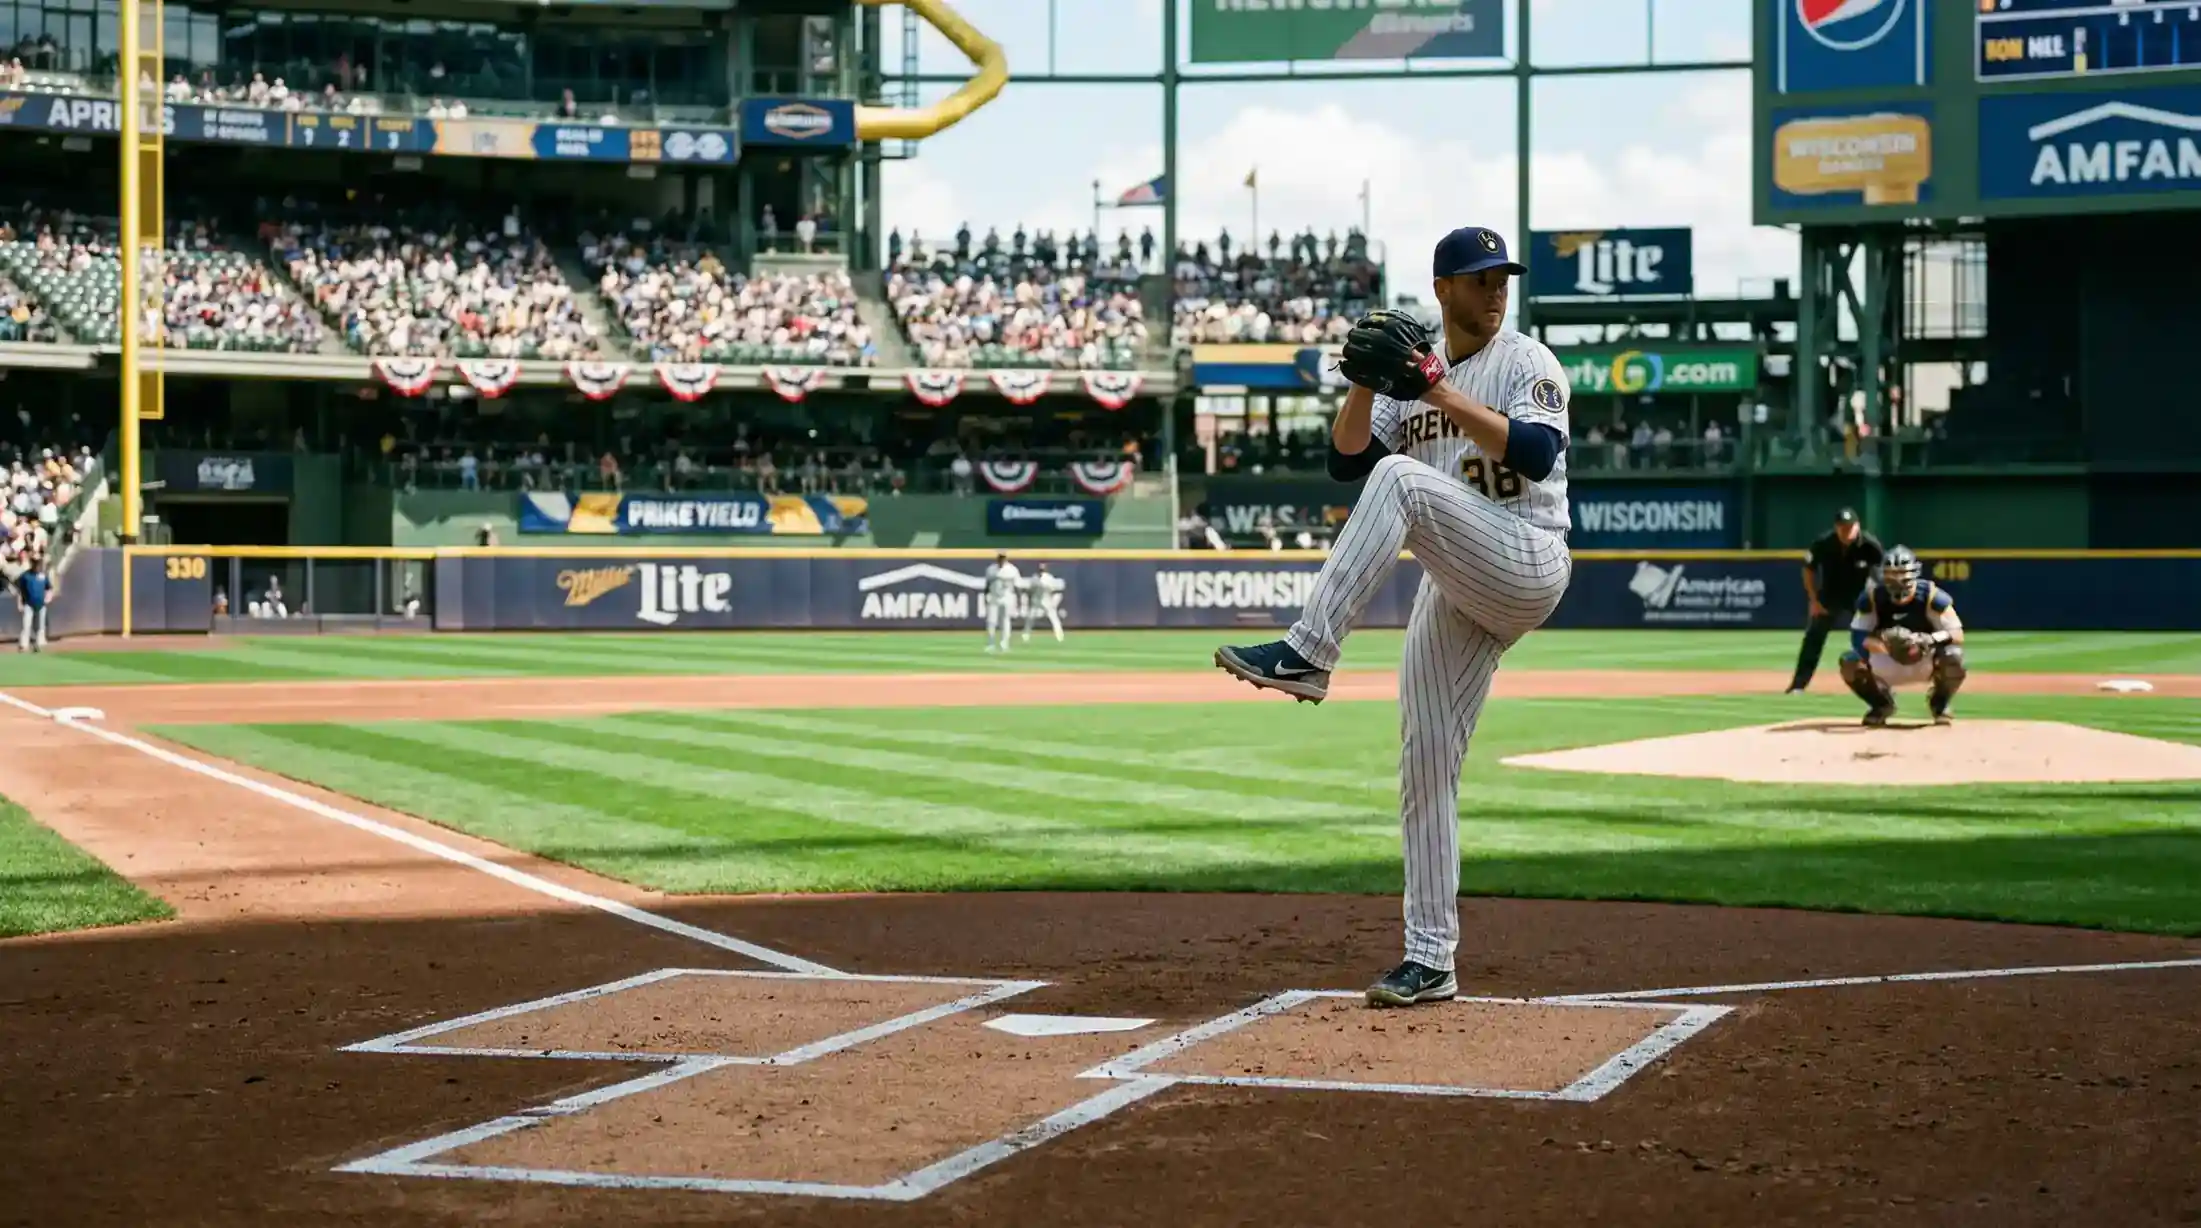
The 2010s were the inflection decade. Between 2010 and 2019, K/9 jumped from approximately 7.0 to 8.8. That acceleration had several drivers working simultaneously. The first was the velocity revolution. Average fastball velocity climbed steadily, adding roughly 2 mph across the decade. Harder pitches give batters less reaction time, which produces more swings and misses. The second was the analytics-driven emphasis on spin rate and pitch movement. Organisations began selecting and developing pitchers specifically for their ability to generate whiffs, and pitchers who could not miss bats were pushed out of rotations regardless of their ERA.
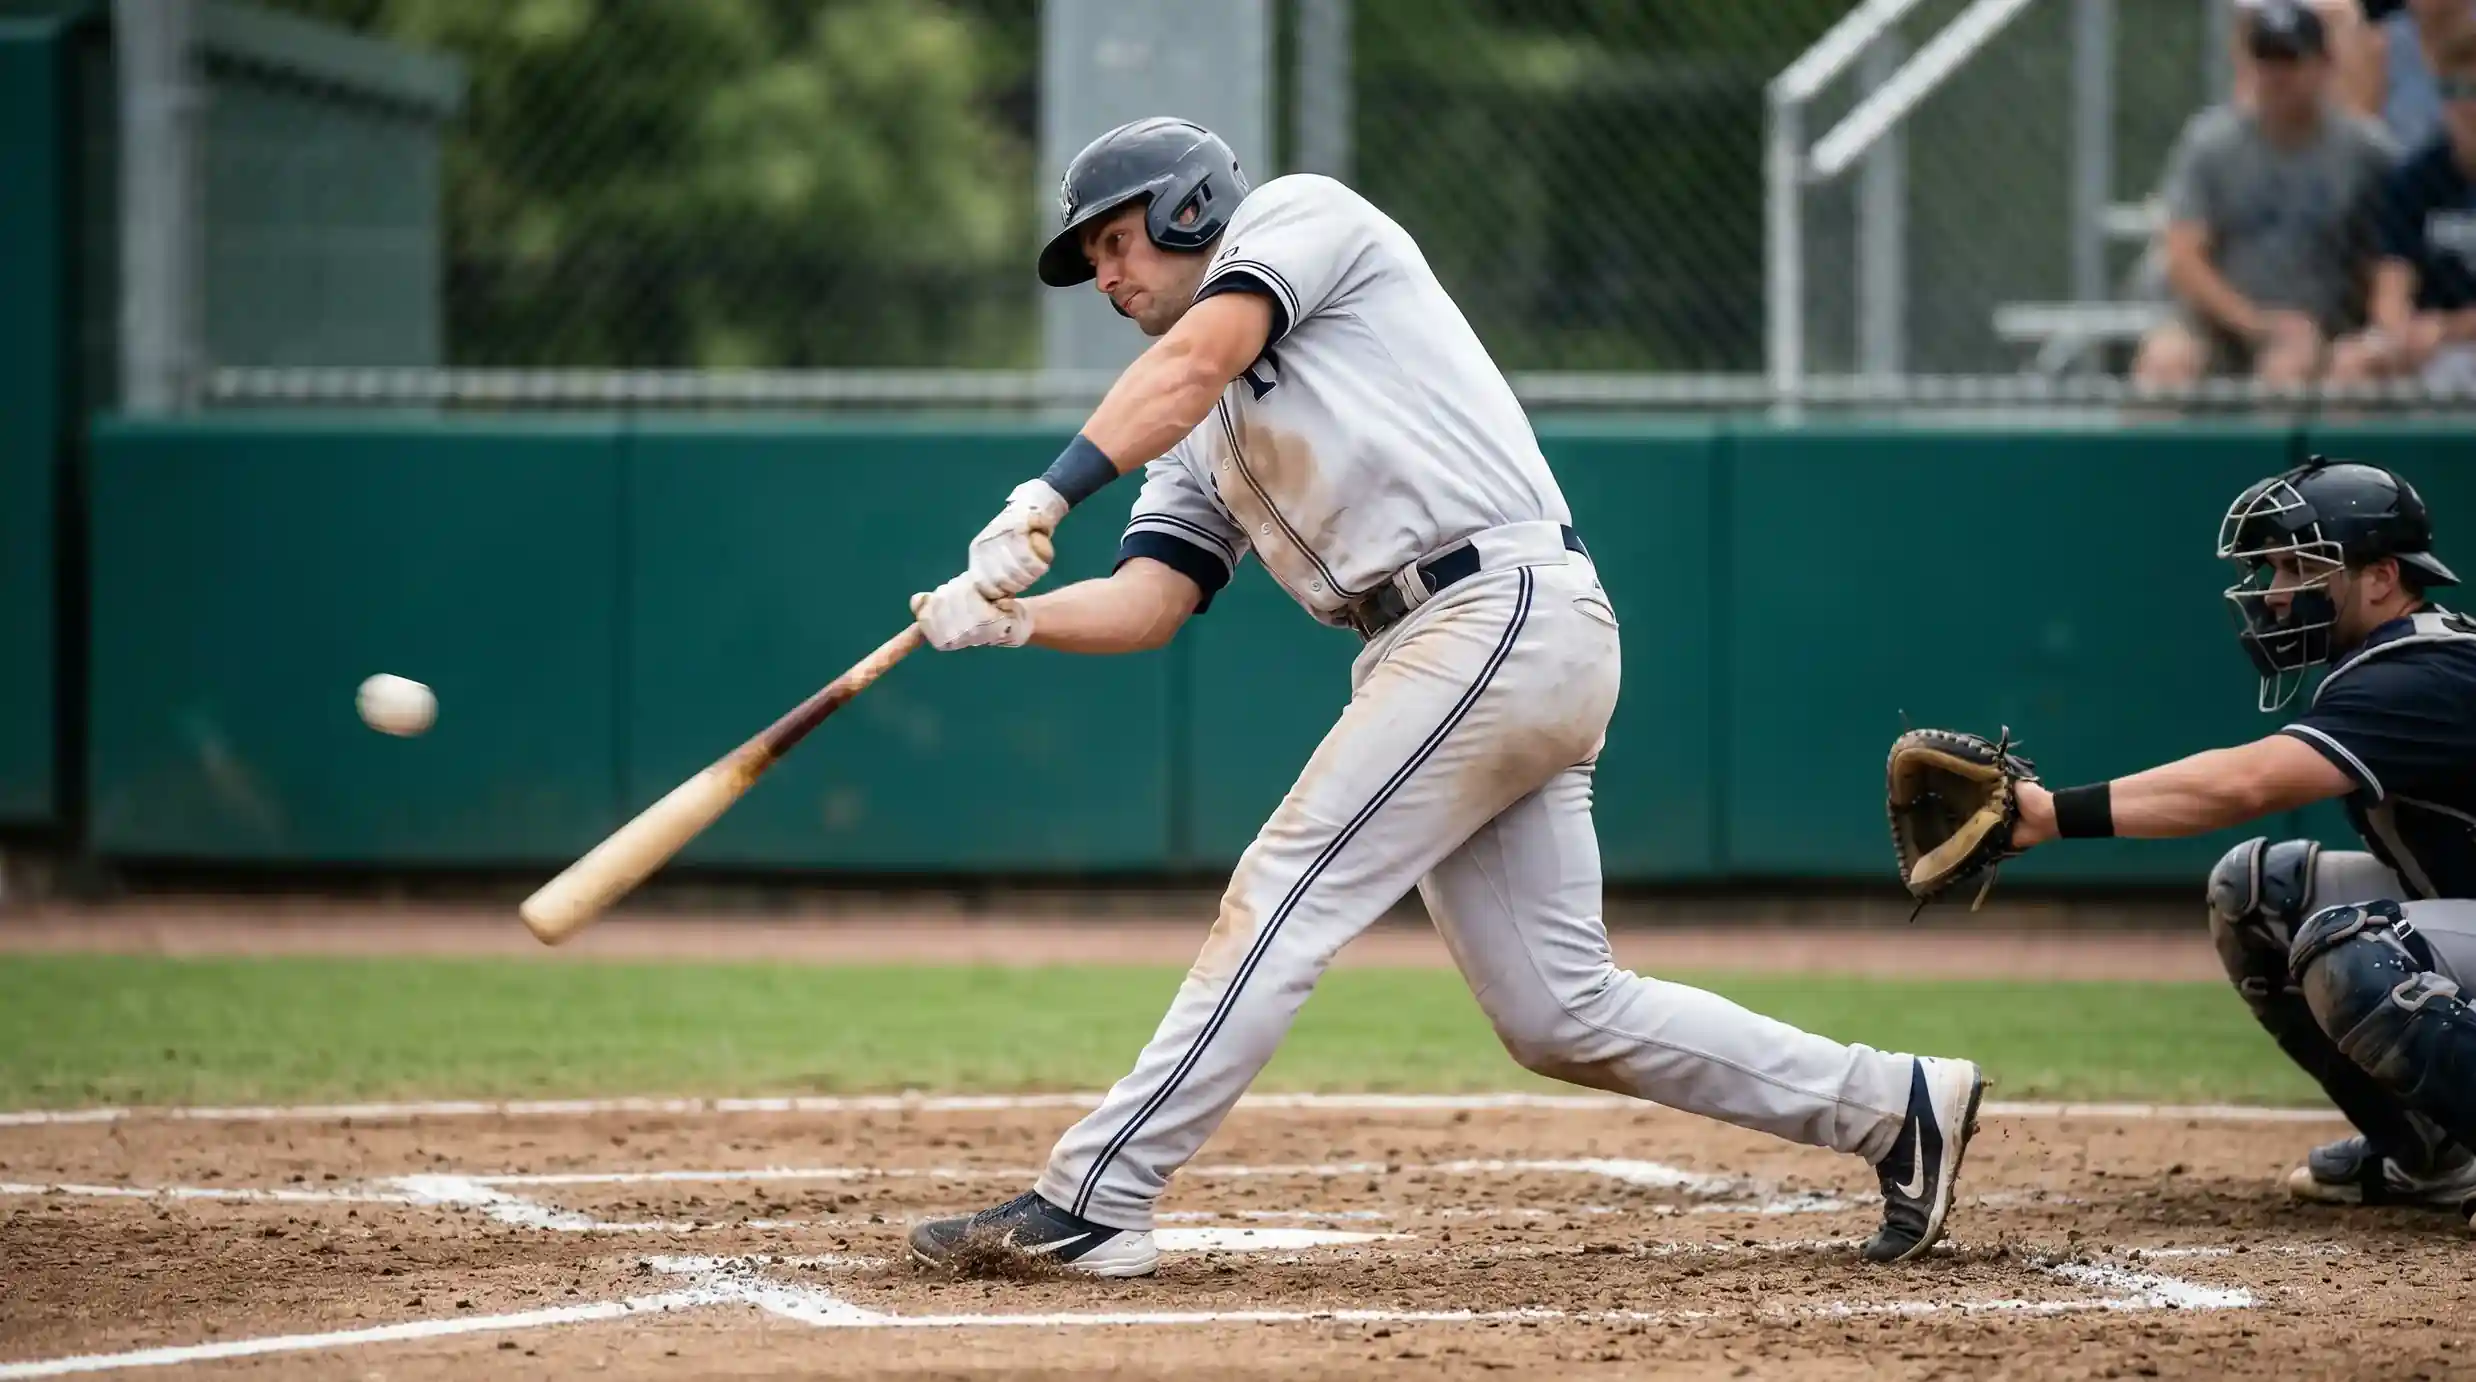
The third driver was the swing-path revolution on the offensive side. Hitters adopted launch-angle-optimised swings, trading contact for power. An uppercut swing designed to lift the ball out of the park is inherently more likely to miss a pitch than a flatter, contact-oriented swing. Batters accepted higher K-rates as the price of higher home-run rates, and front offices endorsed the trade-off because the run-scoring maths favoured power over contact in most contexts.
The 2020s have seen the K-rate plateau at a historically high level rather than continuing to climb. League-wide K/9 has fluctuated between 8.3 and 8.8 since 2021, suggesting the sport may have reached a natural equilibrium – or at least a point where further increases face diminishing returns. Rule changes like the pitch clock (introduced in 2023) were partly designed to compress at-bats and shift some advantage back to batters, but their impact on K-rates has been modest rather than transformative. The total number of Ks per season has remained near its peak, sustained by the structural factors embedded in pitching development and hitting philosophy.
What Drove the Rise and Whether It Continues
Three structural factors underpin the K-rate surge, and assessing each one tells you about the future trajectory.
Pitching development is the most durable factor. Private pitching labs, biomechanical analysis, and spin-rate measurement tools have created a generation of pitchers who are objectively better at generating whiffs than their predecessors. The knowledge is widespread, the training infrastructure is established, and young pitchers entering the league today have been trained to prioritise strikeouts from their teenage years. This factor is not reversing.
Offensive philosophy is more cyclical. The launch-angle revolution may be moderating as some teams experiment with contact-oriented approaches, especially in high-leverage situations. If a meaningful number of organisations shift toward a contact-first approach in their player development, the league-wide K-rate could decline. But this would take years to manifest at the major-league level, because it requires changing the training pipeline from amateur ball through the minor leagues.
Rule changes are the wild card. MLB has shown willingness to intervene – the pitch clock, limits on defensive shifts, adjustments to the ball composition. Future interventions could target strikeouts more directly. A larger strike zone would increase Ks; a smaller one would decrease them. Changes to the baseball’s seam height or surface texture could affect grip and spin, altering K-rates in either direction. These interventions are unpredictable but can have significant short-term effects.
My working assumption for K-prop betting in 2026 is that the elevated K-rate environment persists. The structural factors that produced it are still in place, and no currently announced rule changes target strikeout rates directly. This means the base rates for K props remain historically high, and bettors who calibrate their models to current K-rate levels rather than historical averages will have more accurate projections.
What the K-Rate Trend Means for Your Betting
The sustained high K-rate environment has two practical implications for K-prop bettors. The first is that sportsbook lines have adjusted. Books are not setting K props based on 2010-era K-rates; they are using current data. The rising tide of strikeouts does not automatically make overs more profitable – the lines have risen with the tide. Your edge comes from identifying specific situations where the line has not caught up to the current reality, not from a blanket assumption that Ks are higher than lines suggest.
The second implication is more subtle. In a high-K environment, the variance of strikeout outcomes increases. When the average pitcher records 8+ K/9, the spread between a dominant outing (12 Ks) and a poor outing (4 Ks) is wider than when the average was 6 K/9. That increased variance is good for bettors who can identify upside matchups – there are more potential outlier performances available – but it also means that losing streaks will be longer and more painful than in a lower-variance environment.
Historically, the best K-prop opportunities have appeared when the market was slow to adjust to a shifting environment – early in a new rule-change season, or when a pitcher’s underlying stuff improved faster than his recent K totals reflected. The 25-year trend tells you that the game is structurally built for high strikeout totals. Your job is not to bet that trend blindly; it is to find the specific games where the market has mispriced the elevated baseline. For context on which current lineups are striking out most and how to target them, the article on strikeout-prone MLB lineups covers the 2026 landscape.
Why have MLB strikeout rates risen so dramatically since 2000?
Three primary drivers: the velocity revolution (average fastball speed increased roughly 2 mph over two decades), the analytics-driven emphasis on spin rate and pitch movement in pitcher development, and the offensive shift toward launch-angle-optimised swings that trade contact for power. These structural changes have pushed league-wide K/9 from 5.15 in 2000 to 8.6+ in recent seasons.
Does the rising K-rate trend favour over bets on strikeout props?
Not automatically. Sportsbook lines have adjusted alongside the rising K-rates, so the elevated baseline is already priced into most lines. The trend does mean more high-K outlier performances are available, which creates opportunities for bettors who can identify specific upside matchups. Your edge comes from finding mispriced situations, not from betting overs blindly based on historical trends.
Created by the ”mlb Strikeout Prop Bets” editorial team.