
Building Multi-Factor Scoring Models for Strikeout Props
 Available in US
Integrating SwStr% and Ballpark Data into Scoring Systems
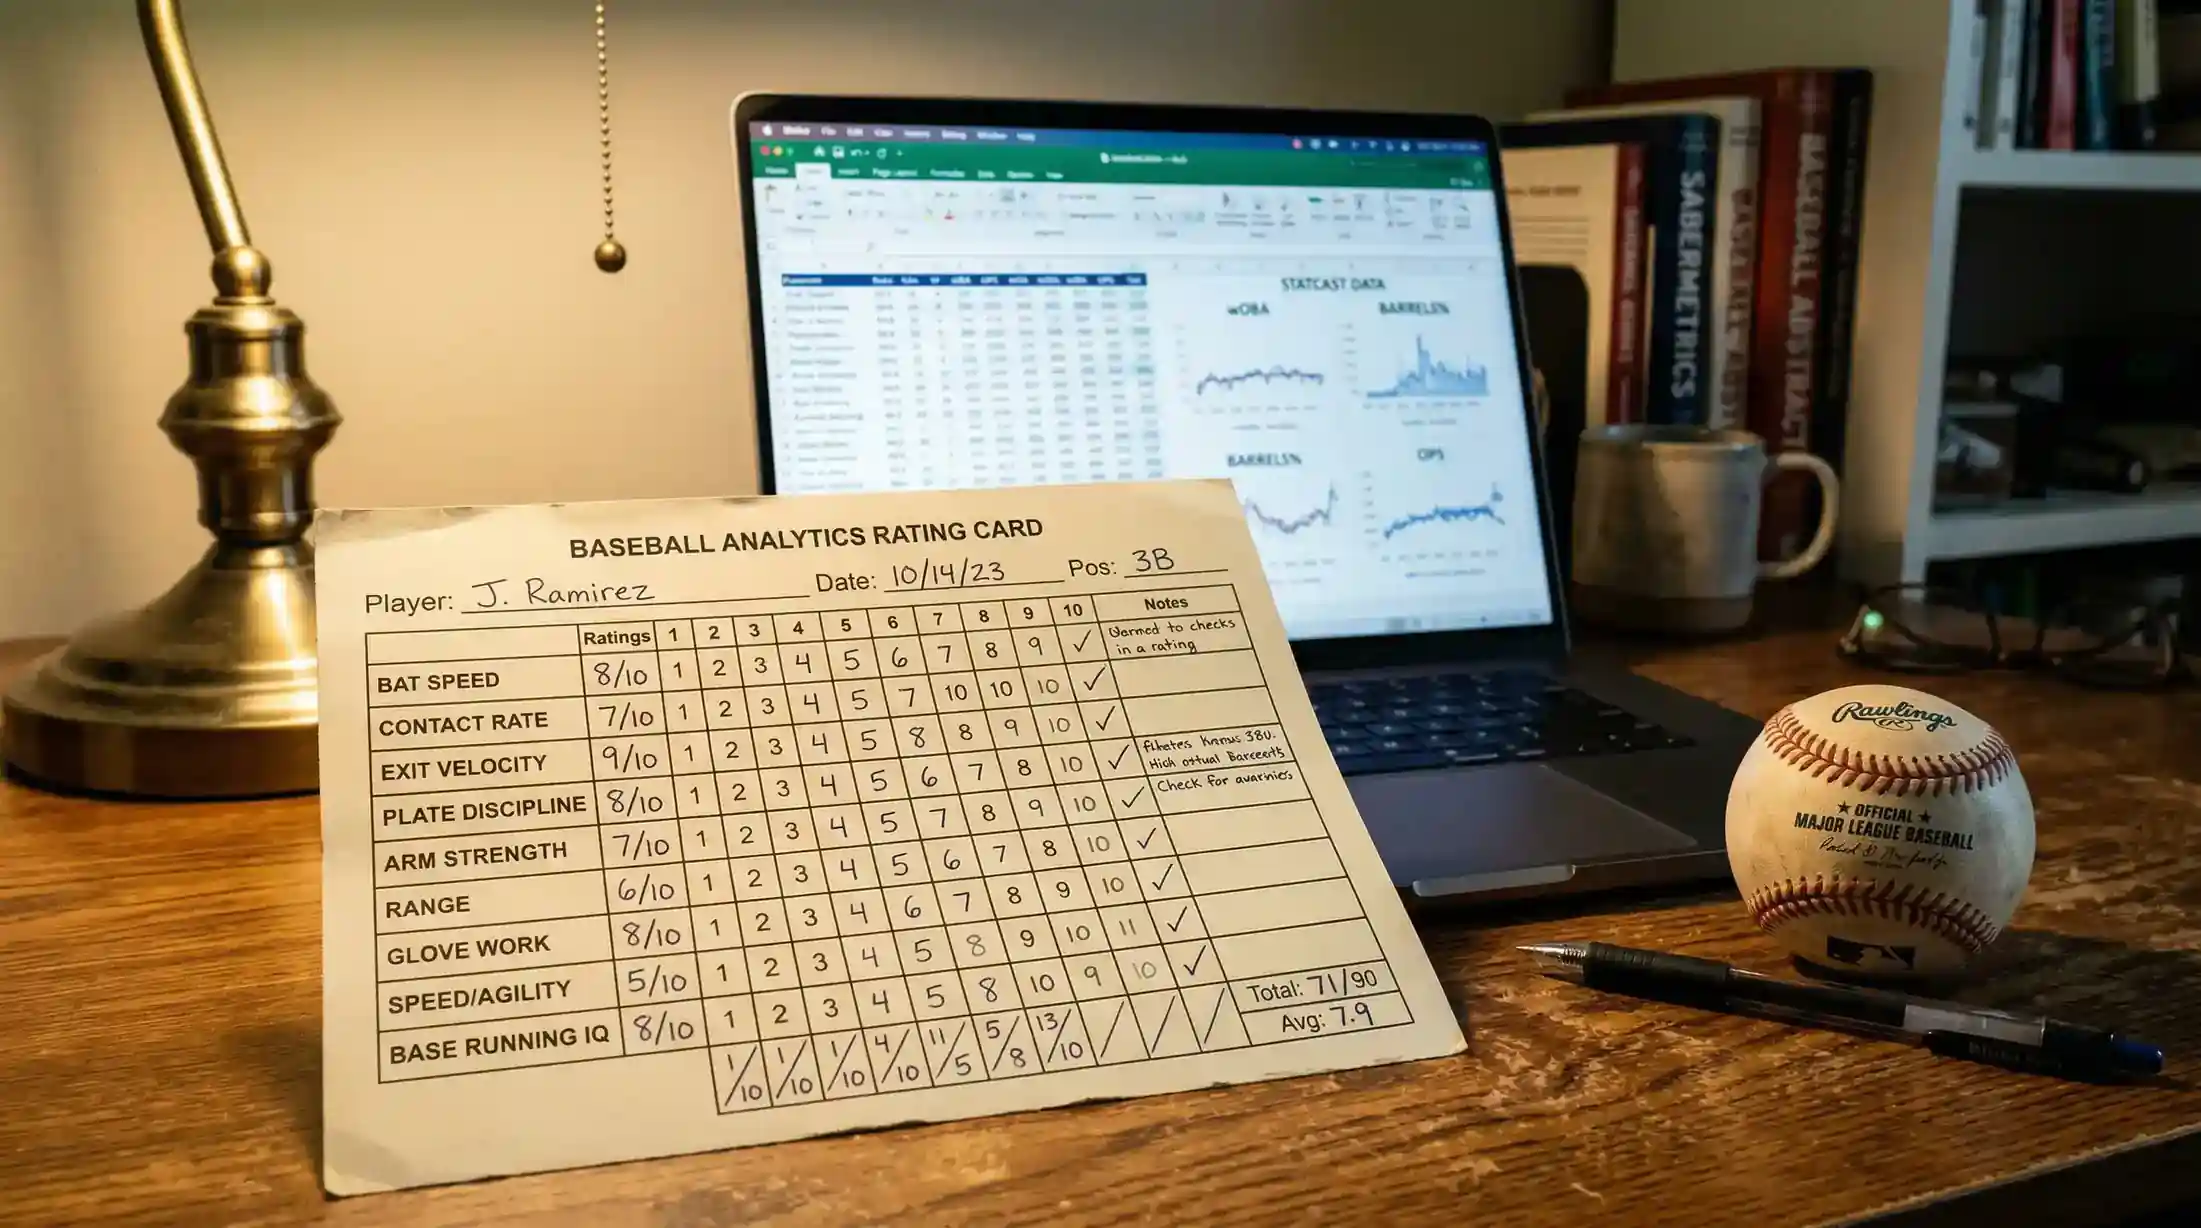
For years, I evaluated K props the way most bettors do – one factor at a time. Good pitcher? Check. Bad lineup? Check. Bet the over. The problem was that “good pitcher versus bad lineup” describes roughly half the games on any given day. I needed a way to separate the genuinely strong opportunities from the merely acceptable ones. The solution was a scoring model that forces every matchup through the same filter, grades it on a consistent scale, and tells me not just whether to bet but how much conviction to attach.
Jason Ziernicki, who founded CLEATZ, built a 7-factor scoring model that integrates SwStr%, season K%, opponent K%, K/9, last-3-starts form, ballpark K-factor, and weather. His insight was that strikeout props tend to offer the most value when elite strikeout pitchers face high-K lineups – but identifying “elite” and “high-K” requires quantification, not intuition. A scoring model does exactly that: it quantifies each factor, sums the scores, and produces a grade that determines your bet sizing.
The Seven Factors and What Each One Captures
Each factor in the scoring model answers a different question about the matchup. Together, they cover the full range of inputs that drive K-prop outcomes. Here is how I define and score each one.
Factor one: SwStr% (swinging strike rate). This measures how often batters swing and miss at the pitcher’s offerings. It is the purest predictor of K-generation ability because it captures the pitcher’s stuff quality independent of opponent, umpire, or luck. I score it on a 0-to-1 scale: above 12% gets 1 point, between 10% and 12% gets 0.5 points, below 10% gets 0 points. Elite K pitchers typically carry SwStr% above 12%, and pitchers below 10% rarely sustain high K-rates regardless of the matchup.
Factor two: season K%. The pitcher’s strikeout rate per batter faced over the current season. This captures overall K-generation including both whiffs and called strikes. Above 28% gets 1 point, 23-28% gets 0.5, below 23% gets 0.
Factor three: opponent K%. The opposing team’s K-rate as a lineup over the last 30 days. This measures how K-prone the specific batting order is. Above 26% gets 1 point, 22-26% gets 0.5, below 22% gets 0. The Oakland Athletics at 37.8% and Chicago White Sox around 36% in early 2026 would both score the full point in this category without question.
Factor four: K/9. Despite its limitations compared to K%, K/9 provides a useful volume check – it tells you how many strikeouts the pitcher tends to accumulate per game outing. Above 9.5 K/9 gets 1 point, 8.0-9.5 gets 0.5, below 8.0 gets 0. Logan Webb’s career-best 9.74 K/9 in 2025, when he led the NL with 224 strikeouts over 207 innings, would score the full point here.
Factor five: last-3-starts form. The pitcher’s K-rate over his three most recent starts, capturing any recent changes in stuff, health, or approach. If recent K-rate is at or above his season average, score 1. If it is within 15% below his season average, score 0.5. If it is more than 15% below, score 0. This factor catches mid-season changes that the season-long metrics have not yet fully reflected.
Factor six: ballpark K-factor. The venue’s historical tendency to produce above or below average strikeout totals. A K-friendly park (top 10 in park factor) scores 1. A neutral park scores 0.5. A K-suppressing park (bottom 10) scores 0.
Factor seven: weather. Game-time conditions that affect grip, spin, and pitch movement. Temperature above 15 degrees Celsius with no significant wind scores 1. Moderate conditions (10-15 degrees or moderate wind) score 0.5. Cold conditions (below 10 degrees) or strong crosswinds score 0. Dome games always score 1.
Weighting the Factors: Not All Points Are Equal
A raw sum of seven factors gives you a score between 0 and 7, but treating all factors equally is a mistake. The factors that most directly drive K outcomes should carry more weight than supporting factors. My current weighting system multiplies each factor’s score by a coefficient before summing.
SwStr% carries the highest weight: coefficient 1.5. This is the single most predictive metric for future strikeouts, and it deserves the most influence on the final score. Season K% carries coefficient 1.25. Opponent K% carries coefficient 1.25. K/9 carries coefficient 0.75 (useful but partially redundant with K%). Last-3-starts form carries coefficient 1.0. Ballpark K-factor carries coefficient 0.5. Weather carries coefficient 0.5.
With these weights, the maximum possible score is (1 x 1.5) + (1 x 1.25) + (1 x 1.25) + (1 x 0.75) + (1 x 1.0) + (1 x 0.5) + (1 x 0.5) = 6.75. My grading scale: above 5.5 is an A-grade bet (highest conviction, 2% bankroll), 4.0-5.5 is B-grade (standard, 1% bankroll), 2.5-4.0 is C-grade (low conviction, 0.5% bankroll or skip), below 2.5 is a skip.
The weighting is not fixed. I recalibrate once per season – at the end of each year, I look at which factors were most correlated with profitable bets and adjust the coefficients accordingly. In 2024, I increased the SwStr% weight after discovering that my A-grade bets where SwStr% scored high had a significantly better hit rate than A-grade bets where SwStr% was average but opponent K% was high. The data told me that pitcher quality mattered more than opponent quality, and I adjusted.
A Worked Example: Scoring a Real Matchup
Walk through a concrete case. A starting pitcher has a 13.2% SwStr% (score 1.0, x1.5 weight = 1.5), a 29% season K% (score 1.0, x1.25 = 1.25), faces a lineup with a 27% K-rate (score 1.0, x1.25 = 1.25), carries a 9.8 K/9 (score 1.0, x0.75 = 0.75), has averaged 8 Ks over his last 3 starts versus a season average of 7.5 so his recent form is above average (score 1.0, x1.0 = 1.0), pitches in a neutral park (score 0.5, x0.5 = 0.25), with game-time temperature at 20 degrees and light wind (score 1.0, x0.5 = 0.5). Total weighted score: 1.5 + 1.25 + 1.25 + 0.75 + 1.0 + 0.25 + 0.5 = 6.5 out of 6.75. This is a clear A-grade bet – every major factor is aligned, and only the neutral park factor prevents a perfect score.
Now consider a weaker example. A pitcher with 10.5% SwStr% (score 0.5, x1.5 = 0.75), 24% season K% (score 0.5, x1.25 = 0.625), faces a 23% K-rate lineup (score 0.5, x1.25 = 0.625), has 8.3 K/9 (score 0.5, x0.75 = 0.375), recent form matching season average (score 1.0, x1.0 = 1.0), K-suppressing venue (score 0, x0.5 = 0), cold weather at 7 degrees (score 0, x0.5 = 0). Total weighted score: 0.75 + 0.625 + 0.625 + 0.375 + 1.0 + 0 + 0 = 3.375. This is a C-grade situation – the pitcher is adequate, the lineup is average, and external factors are working against the over. I would either skip this bet or take a small speculative position if the line offered unusually generous odds.
The model does not make the decision for you. It organises the information so that the decision becomes clearer. When I started using the scoring model consistently, the quality of my K-prop bets improved immediately – not because my underlying analysis changed, but because the model prevented me from talking myself into marginal bets by overweighting one exciting factor while ignoring three mediocre ones. For the broader strategy framework that uses scoring models as one input alongside line analysis and bankroll management, the K-prop strategy guide covers the full decision pipeline.
How do I weight different factors in a K-prop scoring model?
Weight factors by their predictive strength. SwStr% (swinging strike rate) should carry the highest weight because it most directly measures a pitcher’s ability to generate whiffs. Season K% and opponent K% are the next most important. K/9 and recent form sit in the middle tier. Venue and weather carry the lowest weights because they are modifiers rather than primary drivers. Recalibrate the weights annually based on which factors correlated most with profitable bets in the prior season.
Should I rebuild my model weights every season?
Yes, but do it once – at the end of each season. Review which factors were most correlated with your winning bets and adjust coefficients accordingly. Mid-season weight changes risk overfitting to a short stretch of results. A full season of data provides enough sample size to make meaningful adjustments while avoiding reactionary changes based on a bad week or a good month.
Prepared by the mlb Strikeout Prop Bets editorial staff.